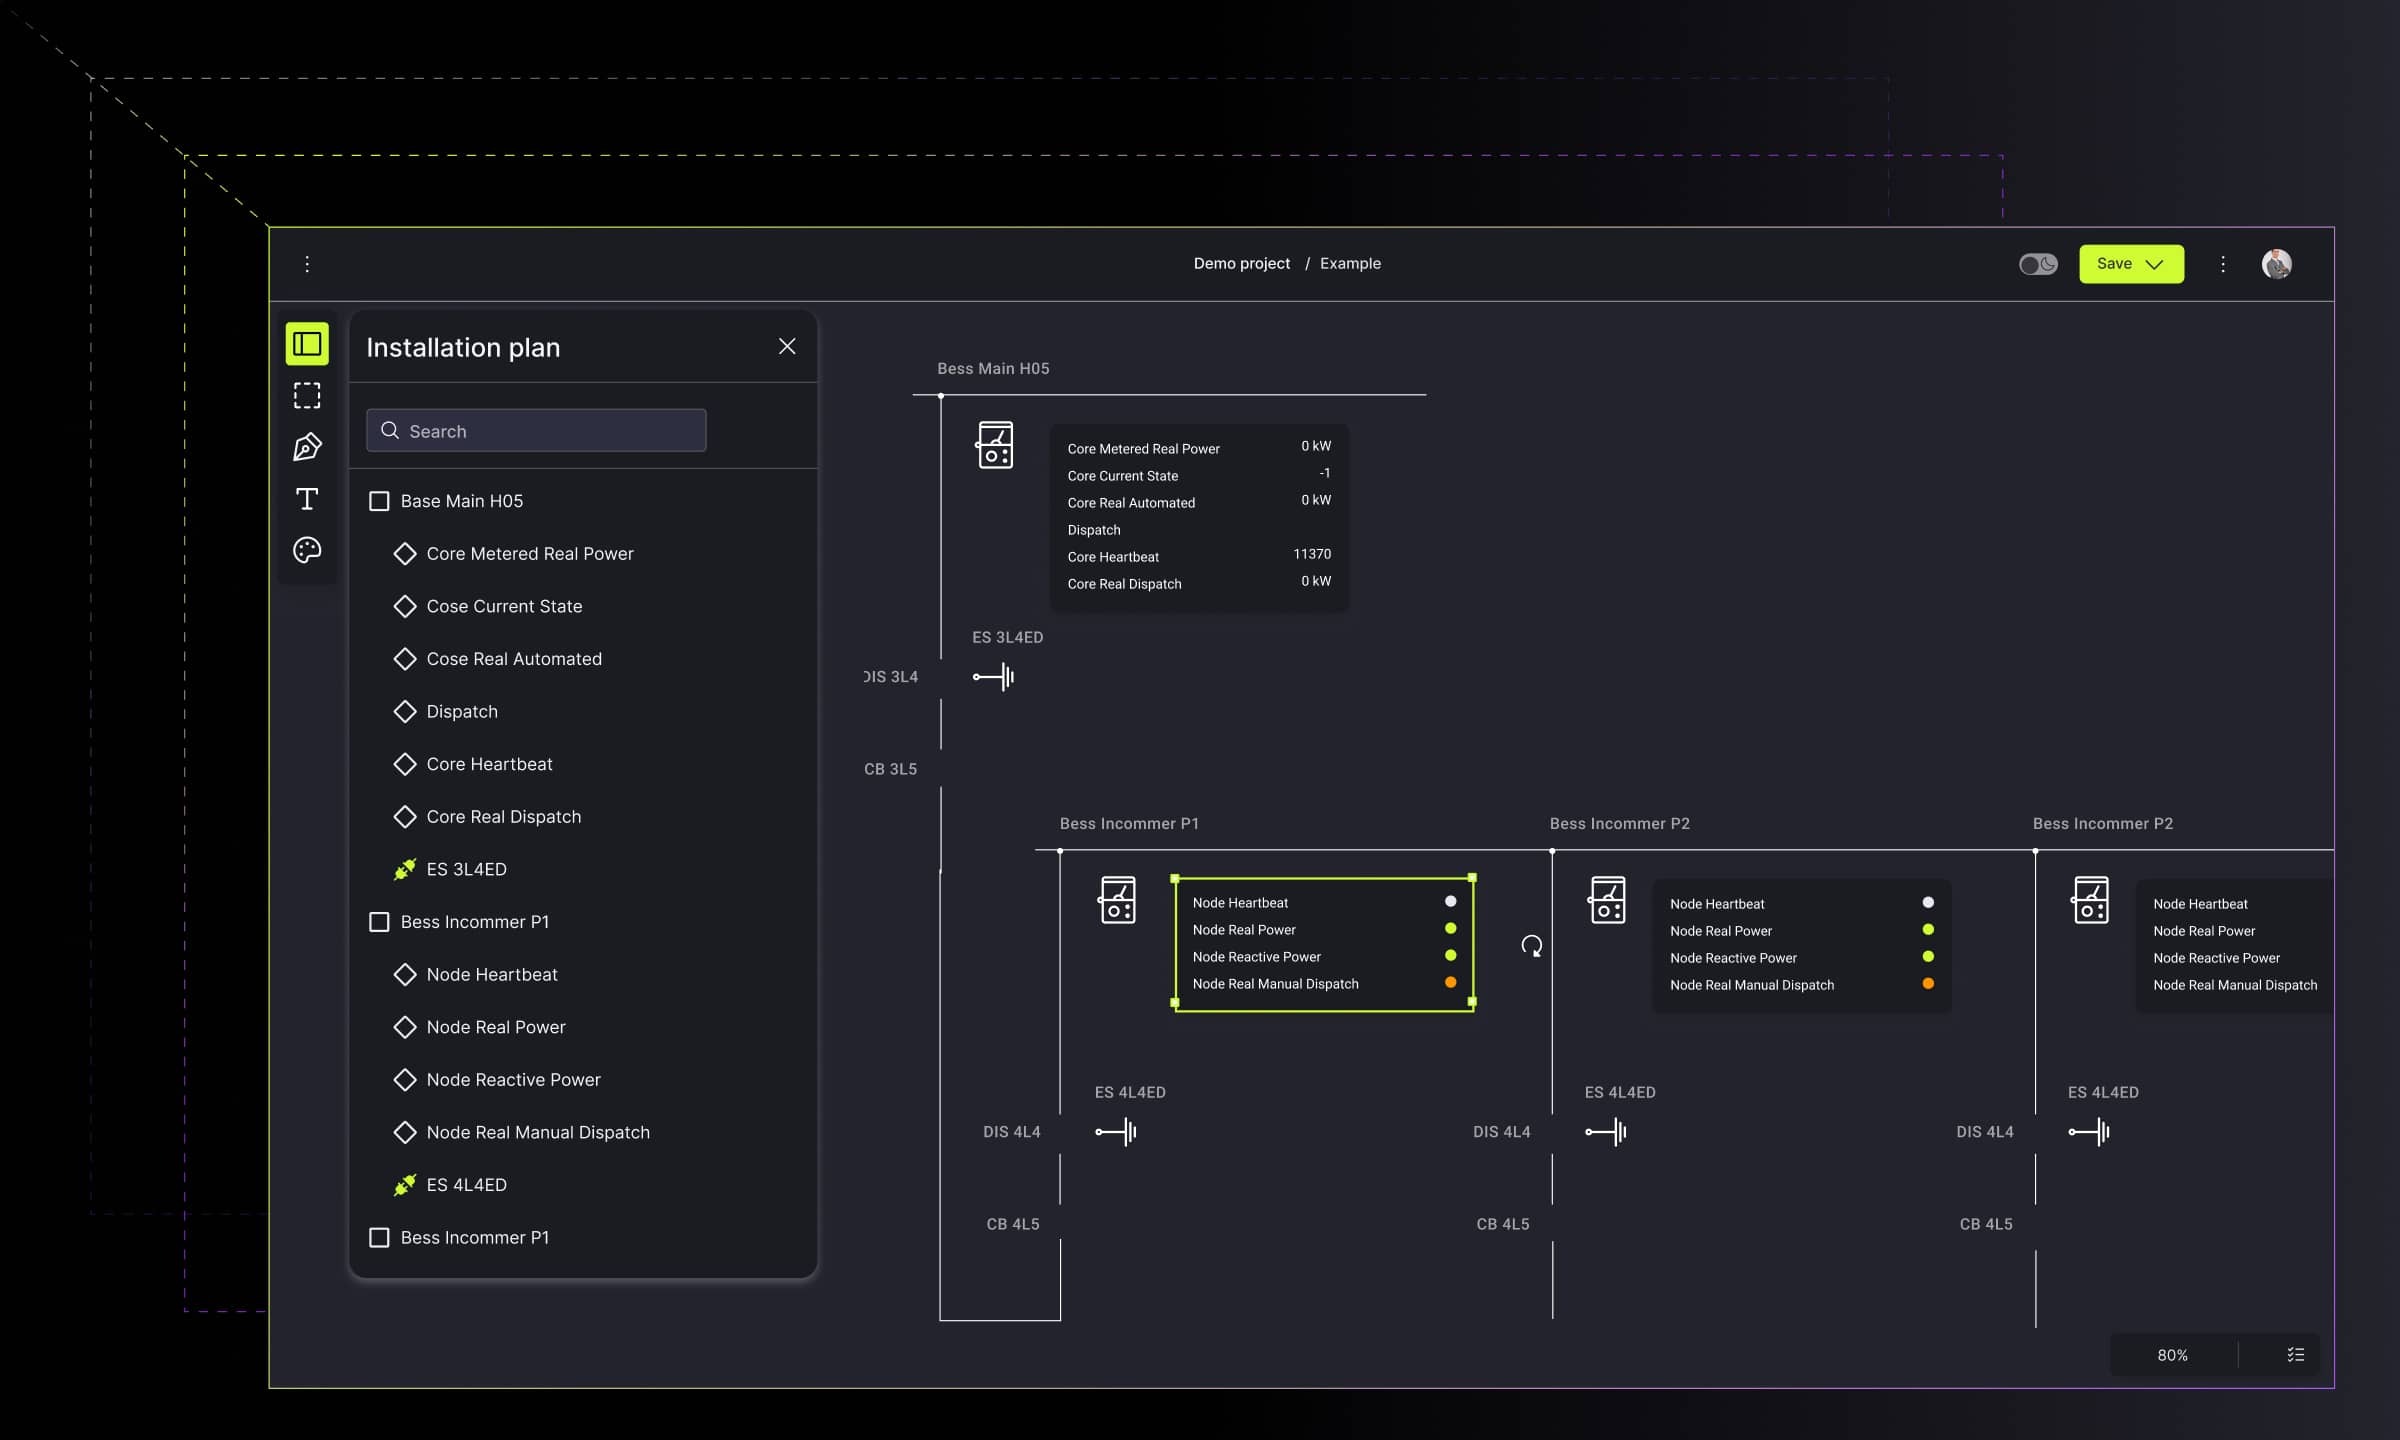
Interactive dashboard and its data-derived power
Learn how interactive dashboards simplify data analysis, enhance real-time collaboration, and support business decisions by turning complex data into insights.

Interactive dashboard is a powerful tool for making data driven business decisions. Learn about the ways it can help your organization excel.
With increasingly large amounts of data at businesses' disposal, static reporting becomes insufficient for driving impactful decisions. A solution is there, ready to be implemented by your organization. Forget about Excel sheets and aim for single-screen data visualization you can filter and interact within real-time. Let me introduce you to the world of interactive dashboards - a modern-day data analysis method that will deliver insights to fuel your decision-making. Keep on reading to learn how you can step up your data analytics game with an interactive dashboard.
Business transformation is happening all around you, and you can either be a part of it or get left behind. If you want to get with the times, embracing a real-time data dashboard for your BI efforts is definitely recommended. Are you at all familiar with Google Analytics? Well, there you have a great example of a free dashboard delivering pretty darn useful reports. Let's have a closer look at how these work.
What are interactive dashboards?
An interactive dashboard finds use in business intelligence and analytics. It's a tool that lets you track, process, and display various business metrics. Most importantly, however, its users can interact with what they see in real-time, thus being able to better understand the raw data and make correct decisions.
Simplification and efficiency is what these dashboards provide. With intelligence steadily piling up, you need powerful and easy-to-use means to analyze it.
How are data dashboards useful?
We've long understood that people take in and process information most efficiently via visual channels. Dashboards make use of this by presenting data in a graphical form and allowing the user to engage with it.
A potent dashboard is an intuitive reporting system that should allow you to:
- get a glimpse of all the relevant KPI on a single screen
- create and assign tasks based on the obtained insights
- easily share the reports you generate
- save time and boost productivity
Creating an optimal dashboard
An interactive analytics dashboard isn't a one-size-fits-all solution. At least not in the way it looks. An efficient one, however, will have a number of common features you should focus on in order to actually make it work for you and draw benefits from the data collected.
Optimal dashboard design should include:
Interactivity - The ability to not only statically display a bar chart or some data points but also to provide the user with the opportunity to apply various filters leading to deeper understanding of the data. An interactive dashboard also lets you act on the presented information, for example, by assigning tasks to relevant team members on the spot.

Visualization - Visual representation of data aids its absorption and understanding. Raw data may be difficult to process for non-specialist. Rendering it in the form of interactive charts makes it more accessible to other members of your organization and so creates more opportunity for valuable insights.

Learn & act - The most useful dashboards offer the option to immediately act on the insights you've gained. This means the ability to create tasks and processes directly from within. Save time by skipping email or the project management platform.

Flexibility & customization - As your business and goals evolve, the dashboard should be able to keep pace. Not every solution in the market will be able to adjust to your growing demands, as well as integrate smoothly into apps and processes already in place.

Staying on the same page - Figuratively and literally. Team members from different departments should be able to access a dashboard and assess their performance at a glance. Everyone being able to see the various KPIs will also increase overall accountability.

Reporting - A dashboard gathers and presents a comprehensive view of multiple data sets, which greatly trims down the time otherwise needed to turn data into information that makes sense. Dashboards perform a lot of the oldschool crunching for you. If you want even more insights, drill down with a couple of clicks.

Where to go from here?
Traditional reporting tools like spreadsheets or presentations may still hold merit in some cases, however, their interactivity is rather limited. Dashboard reporting aims to engage end-users who may not be BI specialists by providing intuitive experience leading to a wide range of insights.
A dashboard allows you to track KPIs and other metrics, process the data, and then present it in a visual manner that supports well-informed business decisions.
There's plenty of off-the-shelf dashboard software available for you to choose from, however, if you're thinking long-term, consider opting for a custom dashboard developed by Synergy Codes. We'd be happy to hear from you regarding creating a tailored dashboard solution that will contribute to your company's growth.
Find how we can help you enhance your software and win more deals
Contact us to discuss your project. After you submit the form, we’ll get in touch with you within 48 hours to arrange a call.


