Simulations management with interactive diagrams
Interactive diagrams in simulations help test system operations, identify faults, and optimize processes, improving systems in industries like oil and gas.

Simulations with the use of interactive diagrams allow you to test the operation of a tool, system, or data flow. Conducting a well-planned simulation leads to recognition of any faults or improper system functioning resulting from irregularities related to the components used in a given system.
Here's a description of the use of data visualization in simulations, which are designed to employ the full potential of diagrams, lower the starting point for simulation management, and the principles of building a graphical interface in simulation tools based on use cases.
What are simulations?
The contemporary sciences use a wide and diverse range of simulations in various areas such as aeronautics, chemistry, bioinformatics, social sciences, AI, the physics of elementary particles, and most other scientific fields.
In simple words, a simulation is a mathematical model that describes or creates computationally a system process. These are the best cognitive representations of complex reality, that is, the deepest conception of reality.
When using data visualization, or more precisely interactive diagrams, in simulations, it most often focuses on visualizing the flow of a specific system or data flow. To prove the correct operation of the system, and at the same understand its characteristics, or to design appropriate actions in the system, you need to focus on the:
- The role and operation of appropriately selected diagrams.
- The type of diagrams used in the simulation.
- The validity of using appropriate visualization techniques.
The advantages of the simulation approach
Before we discuss the use of diagrams in simulations, there are advantages to using this approach.
Basically, we can use simulations in two cases. When dealing with complex scenarios involving a multitude of probabilistic events, the user cares about:
- corrective maintenance, thus excluding possible errors at any stage of the simulation,
- preventive maintenance, which aims to prevent the user from errors in the system,
- inspections, which are planned activities designed to diagnose the operation of the system and its correct functioning,
- imperfect repairs, which usually affect the performance of the entire system,
- crew response times facilitating the efficient operation of the system and reacting to any alerts appearing during work,
- spare part availability which is a permanent element to be monitored.
The second case is implementing the analytical solutions for complex systems. It allows you to keep an eye on the entire system, monitor its operation, and prevent any malfunctions that may affect the correctness of the actions performed.
The legitimacy of using the simulation is expressed in activities such as:
- Examining resource utilization, efficiency, and costs.
Thanks to constant work monitoring, users and system administrators fully picture the system's functioning.
- Optimizing procedures and resource allocation.
Due to the way the system is managed, users and administrators can optimize its operation and improve the output using the collected data.
- Analyzing relationships between systems and components.
Enabling the collection of data from multiple systems at the same time allows you to examine all dependencies and relationships between these data.
- Minimizing work downtimes.
Reducing the number of system shutdowns and system scaling for various overhaul and repair work.
The drawbacks of the simulation approach
Of course, apart from the great number of positives resulting from the implementation of the simulation approach, several disadvantages should be kept in mind. These include, among others:
- It can be time-consuming.
The implementation of the simulation approach involves the tools and task base preparation.
- The results are dependent on the number of simulations.
The use of an appropriate simulation tool requires in-depth knowledge of the process and the outcome of all activities. Therefore, it is worth planning enough simulation tests to obtain a reliable analysis.
- There is a lack of repeatability in the results due to the random nature of data generation. The lack of an appropriate simulation tool can cause data errors. It happens that the data changes, and therefore there are faults in the system.
For these reasons, if your scenario and/or results of interest do not require you to use a simulation diagram, it is recommended that you use an analytical diagram.
Interactive diagram in simulations
The variety of interactive diagrams used in simulations allows you to choose the right solution. Therefore, their creation should start with an analysis and the system validity, which are to be supported by diagrams. Their usefulness depends on the scenario underlying the task. You can choose from various diagrams such as:
Purpose:
To simulate different data feeds. It validates various data formats.
Simulation method:
The user observes the flow of data in the diagram and has full control over their behavior. Having the data downloaded from the database at his disposal, the user independently makes decisions about their movement in the diagram and builds dependencies between them. By illustrating the individual results of the actions performed, the diagram is the basis for developing further dependencies.
Example:
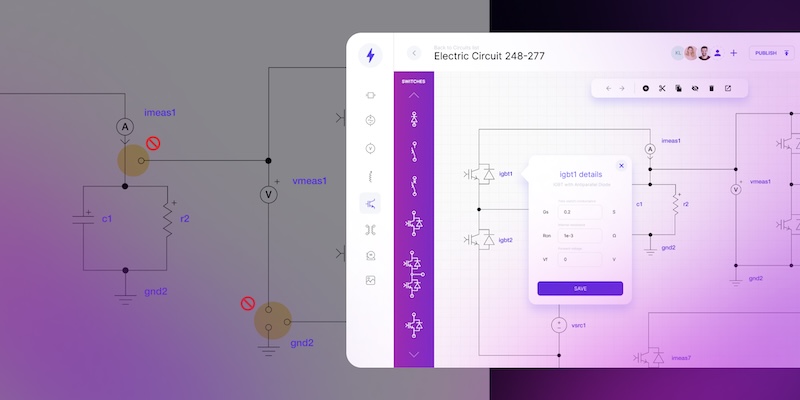
Based on the project of building a schematic editor for the electrical network, we obtained the simulation effect using advanced functionalities supported by GoJS, React, PostgreSQL, and .NET Core technologies. They included, among others: customized palette with custom nodes used via drag & drop, assigned internal linking system with forking with the support of the appropriate algorithms, real-time validation of electric nodes, rotate to view the alignment of lines in real-time, building up subsystems, and undo manager mechanism.

- Diagrams for departments
Purpose:
to simulate divisions and changes in its structure.
The way of simulation:
The user can plan and check the functioning of divisions thanks to an interactive diagram showing the relationships between elements. Using an org chart, OKR maps, or organizational diagrams, the user places individual people/activities and roles and connects them via links.
Example:
OKR map allows you to understand the order of the tasks and give them a proper priority. The full view of the entire organization enables you to learn what division/department is currently working on and who exactly is assigned to a particular task. Implementation of the progress bar allows you to monitor the tasks. The detailed view of each task broken down into subtasks enables full insight into the progress. What's more - it is possible to modify activities, both in terms of the assigned owner and department.


Purpose:
To simulate load balancers action in server house/data center infrastructure
Simulation way:
Digital twins are already commonly used in organizations, especially in those which have to keep up with changing customer preferences. It allows businesses to deliver high-quality products at a fast pace. They allow you to perform activities such as:
• Test products in the real use cases
• Revamp their initial assumptions due to predictive analytics
• Connect data coming from many silos
• Identify and understand the nature of potential faults
• Reduce the risk of putting faulty products into the market.
Example:
The digital twin is great for applications designed for modern production companies, such as hydroponic farms. Using interactive diagrams and dashboards, the user can manage and collect the real-time data in a neat visual way. The interactive diagrams support the users in taking up any economic decisions and manage the farm precisely. With the usage of IoT, i.e., sensors that monitor the conditions of cultivation on an ongoing basis, you can detect possible problems or improve work. Except the live monitoring, it makes a great deal for facilitating daily works, generating savings, and planning further expansion. Having all data gathered, you could plan your sales, estimate costs, or even modify the farm size to achieve effective management.


How to prepare for the simulation?
To prepare for the simulation, you should first thoroughly familiarize yourself with modern ways of working with data modeling. The deeper and broader the knowledge of Machine Learning and Robotic Process Automation is, the faster we can proceed to the error-free tool selection and simulation method.
The next step is to get to know the specifics of the process flow diagrams. They are the most common variant of the diagram used in simulations.
On the example of a tool created for a customer of the oil & gas industry, an appropriate application for simulating events in the system using process flow diagrams was used and developed. This type of diagram is commonly used in chemical and process engineering to indicate the general flow of plant processes and equipment. A simple SCADA diagram, with animation of the flow along the pipes, is implemented here.

This example reflects what changes exactly occur during the manipulation on a selected part of the diagram. This applies to closing, opening, and adding further diagram elements with flows, and thus obtaining a simulation of the results of the actions performed.
For a given diagram to illustrate the simulation well, first of all, you should take care of a good model. Modeling consists of taking appropriate data from databases and creating diagrams corresponding to the actual state in the system. The use of custom nodes and links enables the user to build a scheme and test its operation using interactive simulations.
In the oil & gas industry, the most crucial issue in modeling is creating the correct direction of the flows. In this case, various types of custom links are in use. The creator of the simulation tool can utilize different types of links - dashed lines, solid lines, mixed lines. Additionally, the highlights and coloring are helpful to mark various states of liquid concentration on individual parts of the diagram.
Moreover, in the simulation scheme, it is possible to include various types of alerts that inform about occurring flow issues in the system. Therefore, the user knows at what stage and after which actions a problem may arise. There are different levels of notification - depending on the threat type and its priority.
Note that having a digital twin or pipeline enables giving you a safe area for security and H&S scenarios exploration. Do not only create a diagram, choose a tool that enables you more advanced scenarios.
Such tools support creating different types of templates and multiple canvases with the same data loaded. The user then can compare different action scenarios at the same time.
Exploring the simulations with the GoJS library
JS visual libraries such as GoJS work well for creating interactive diagrams used in simulations. It is dedicated specifically to the needs of diagrams and therefore adapted to the creation of appropriate visualizations based on charts and graphs.
GoJS used in simulations allows for:
- templating that can be reused - we use previously created templates to superimpose data on them and observe changes in the simulation.
- acting like a state machine. We can record, save and recreate the required state for further analysis.
- enables views adjustment - choosing different data representation for one data model to change templating data
- virtualization - helps you process big data sets or map gid infrastructures
- supporting real time data feed - having a digital representation of new updated infrastructure enables running real-time sensors or simulation data.
Wrap-up
Simulations require an appropriate tool, but when carried out correctly, they facilitate work with large infrastructures. Thanks to their flexibility and the possibility of modification, they support modifications and tests of new solutions. In turn, the use of interactive diagrams allows you to build new systems, but also to improve the ones that have already been created. In turn, it translates into the possibility of planning the expansion of the entire infrastructure or its part.

A team of authors and subject matter experts (SMEs), including former employees, who played an active role in content creation.

Find how we can help you enhance your software and win more deals
Contact us to discuss your project. After you submit the form, we’ll get in touch with you within 48 hours to arrange a call.