What is P&ID (Piping and Instrumentation Diagram)?

Learn how custom P&ID tools and simulations transform plant management, enhancing productivity, reducing risks, and enabling real-time process analysis.
_.jpg)
A P&ID diagram captures the functional relationship between equipment, instruments and control systems that drive plant processes and broader industrial processes. With modern P&ID diagram software, you track how each component works, test scenarios and manage operations in real time – giving you clearer oversight, fewer risks and faster engineering and business decisions.
P&ID (Piping and Instrumentation Diagram or Drawing) is a technical drawing used in process engineering. It represents all details of the chemical process at processing plants, such as oil refineries, food processing plants, cement plants, pharmaceutical manufacturing facilities, or other plants where raw material is chemically or mechanically turned into ingredients or finished products.
Everyone involved in the design, construction, management, operations, or maintenance of a process plant, will have to work with a P&ID (Piping and Instrumentation Diagram) at some point. Therefore, everyone should either know how to read these drawings or have a good graphic interface or simulation software to access them, as they are basically a representation of how the processing facility works.
This article is for engineers, product owners and technical leads who want to manage industrial systems in real time and run digital tests to predict issues, validate ideas and keep process under control.
Build custom P&ID and CAD automation tools
Learn more.png)
How to create a P&ID
Back in the day, designers, constructors, engineers, managers, and staff of process facilities had to work with multiple hand-drawn P&IDs. Those Piping and Instrumentation Diagrams drawings would all need to be updated whenever the parameters of the process changed – be it at the design and construction stage, or during plant operation, or when some equipment was modernized. Even after CAD software was introduced, managing an archive of all these drawings took hours of very meticulous work and strict procedures.
Today, the way we use and manage P&IDs is much more intelligent and faster. Not only are there dedicated Piping and Instrumentation Diagrams software and database systems out there, but with an experienced developer team, you can create a custom, collaborative tool that guides you through design and budgeting, safety regulations, and provides a live simulation of the whole facility.
Before we dive in, it helps to know what a complete P&ID includes – these elements shape how effectively you understand and control your process.
What is included in P&ID diagrams
Piping and Instrumentation Diagrams contains all the details about physical components involved in material processing, i.e.:
- Process equipment with specifications (e.g. turbines, fans, vessels, pumps, etc.);
- Piping and line specifications, as well as process piping system components (e.g. fittings, flanges, valves, actuators, insulation, etc.);
- Instrumentation and control system components (e.g. indicators, gauges, alarms, interlocks, control input and output);
The function of P&IDs is also to specify parameters of those components as well as parameters of the processed material flowing along the pipelines and the operating procedures of the facility:
- Flow directions and process variables such as temperature, pressure or flow rate;
- Material specifications;
- Computer Control System input.
Now that we know what a P&ID includes, let’s look at how to read those elements in practice.
How to read P&ID drawings
Piping and Instrumentation Diagrams – unlike floor plans or maps – are not scaled drawings. They don't visually represent the proximity of given components, their shape, or their physical coordinates in the facility. Their main purpose is to show the parameters and elements of the processing system, not its proportions or topography.
Symbols drawn in P&IDs are represented by codes and graphic symbols. These may vary from company to company, so P&IDs (Piping and Instrumentation Diagram) come with Lead Sheets (or Legend Sheets) attached, where notation rules and symbols are explained. Usually, they follow industry standards, such as ANSI/ISA-5.1-2009 (Instrumentation Symbols and Identification).
Because going back and forth between the process drawing and the Lead Sheet is quite cumbersome, a more convenient approach might be displaying the processing facility in a digital model instead, where all the relevant information is easily accessible.
P&ID codes and symbols
P&IDs are invaluable documents to keep on hand for streamlining existing processes, replacing equipment, or guiding the design and implementation of new facilities. Therefore, drawings must be legible and understandable for different teams.
Decoding P&ID tagging systems
Every engineering team establishes their own instrument and equipment tagging convention and explains it on the Lead Sheet. The instrument tags are written in callout bubbles next to the device or inline with the piping or electrical line.
_.jpg)
There are some common tagging conventions. For example:
_.jpg)
- "P" - First Letter stands for "Pressure"
- "D" - Second letter is a modifier for the first and stands for "Differential"
- "I" - Third letter stands for "Indicating"
- "T" - Fourth letter stands for "Transmitter"
- 1703 is the loop number (the Electrical Engineering eggheads need loop numbers too)
You can find a fuller identification and reference designation list on Wikipedia or in the ISA-5.1 standard guide.
P&ID symbols
Here are some of the P&ID (Piping and Instrumentation Diagram) instrument symbols you are most likely to encounter in the processing industry:
Instruments
Devices used for measurement and control of fluids and material streams. They measure, display, and control parameters such as flow, temperature, pressure, etc.
Instruments are identified on the P&ID diagram through their tagging code (according to a tagging convention included in the Lead Sheet), while the graphic symbol of the instrument represents how it can be accessed and operated, rather than what the device's function is (for example, a pressure gauge can be represented by the same graphic symbol as level transmitter – they will be identified through their tags).
_.jpg)
For example:
Piping
Lines connecting different parts of the process, where the media flows through. These are pipes, tubes, and hoses. Process lines on the drawing will also have a tag with parameters such as line number, piping size, class, insulation, etc.lines connecting different parts of the process, where the media flows through. These are pipes, tubes, and hoses. Process lines on the drawing will also have a tag with parameters such as line number, piping size, class, insulation, etc.
_.jpg)
Communication/Signal lines
Lines representing process control systems, with different signal types to communicate information between components, instruments, and the control system computers.
_.jpg)
Process equipment
There are dozens of different equipment types that are used in process engineering, and each one of them can be drawn differently on Piping and Instrumentation Diagrams according to a given company's guidelines. Below, you can see some of the examples of the most common ones.
Valves – the essential elements that regulate, direct, or control the flow of a fluid in the pipeline, by opening, closing, or partially obstructing the passageways.
_.jpg)
Vessels – containers where fluids are stored or processed through chemical reactions, mechanical manipulation, heating, cooling, stirring, and other methods.
_.jpg)
Pumps – devices that move fluids (liquids or gases), or sometimes slurries, along the pipeline.
_.jpg)
Other equipment - there are dozens of other types of process equipment that would make their own book to be listed. Some typical examples are fans, turbines, motors, conveyors, compressors, drains, and many others.
On top of that – every company can add their proprietary equipment and this is why engineers use their own P&ID graphic libraries in the design software they use.
Examples of process equipment:
_.jpg)
More P&ID (Piping and Instrumentation Diagram) examples
The best way to start learning how to draw a P&ID is to study diagrams made by other engineers. The examples below can be a good reference for how these documents are laid out and annotated:
4) Typical compressor P&ID via EnggCyclopedia
With these examples in mind, we can move on to how P&ID supports everyday process engineering.
How is P&ID used in process engineering?
Piping and Instrumentation Diagram is a more detailed elaboration of a Process Flow Diagram (PFD). PFD is the main drawing created by process engineers to show the relationships between a chemical process' major equipment (pumps, vessels, turbines, heaters, etc.) and the flow and properties of chemical fluids used in the process (temperature, pressure, fluid density, flow rate, etc.) The process Flow Diagram doesn't show minor components (e.g. pressure-flow instruments) nor details about piping systems in the facility.
P&IDs (Piping and Instrumentation Diagram) are used in design, development, operations, management and maintenance of chemical processing plants. They are used extensively by all engineering disciplines, like process, piping, mechanical, civil, electrical and instrumentation.
Process design and development
P&IDs are usually developed by process engineers based on the PFD to add details required for the facility design and construction project.
P&IDs are used in front-end engineering design (FEED) as well as engineering, procurement, and construction (EPC), where they serve as a basis to generate a “Bill of Materials.”
P&ID is the roadmap of any process plant engineering project. It is used to plan its staffing, timeline, and budget. Other engineers, project managers, and construction workers use it as a basis for their work, so small changes made to P&IDs (Piping and Instrumentation Diagram) during the construction stage might force other engineers or contractors to redo their work, causing delays and additional costs.
Piping engineers use P&IDs for material procurement and for designing pipe routing in the plant, electrical engineers use it to plan electrical circuits and architects – to design the facility building. Multiple, connected P&IDs are created for different parts of the process flow of a processing facility
Operations, safety and maintenance
P&IDs are used for operation, control, and shut-down procedures of a processing plant. They specify regulatory and plant safety requirements; they are used to developing facility operation guidelines (such as start-up and shut-down, monitoring procedures) and standards. Piping and Instrumentation Diagram is also a guide for operational data.
They are used in the training of facility operating staff, field engineers, and maintenance professionals. P&ID is the fundamental document for HAZOP, Model review, and Process Safety Management.
Over the plant's lifetime, P&IDs are usually updated as the facility gets expanded, modernized, or modified to meet recommendations of Process Safety Management audits.
With these operational and safety roles in place, it’s time to see how custom-built P&ID software strengthens process design and day-to-day management.
How a custom-built P&ID software makes a difference in process design and management
Although there is a set of standards for P&ID (Piping and Instrumentation Diagram) drawings, every company that needs to make them has different needs, graphic styles, and workflows. This is where collaborating with software developers on a customized solution can end up saving costs further down the line.
Visualize and monitor systems with real-time diagrams
See how
Personalized P&ID (Piping and Instrumentation Diagram) interfaces for managers and non-engineers
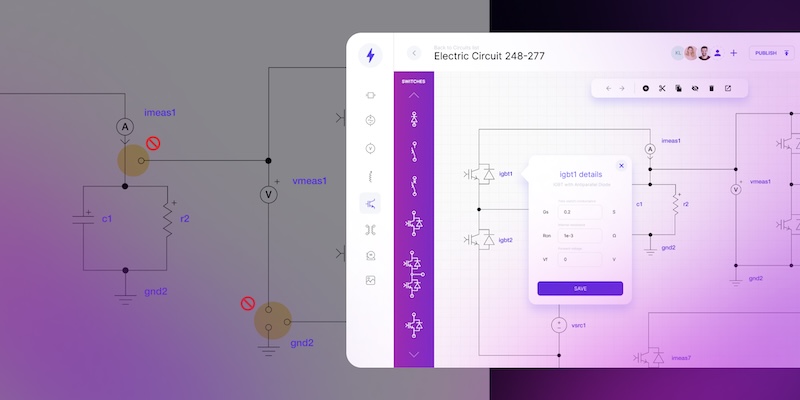
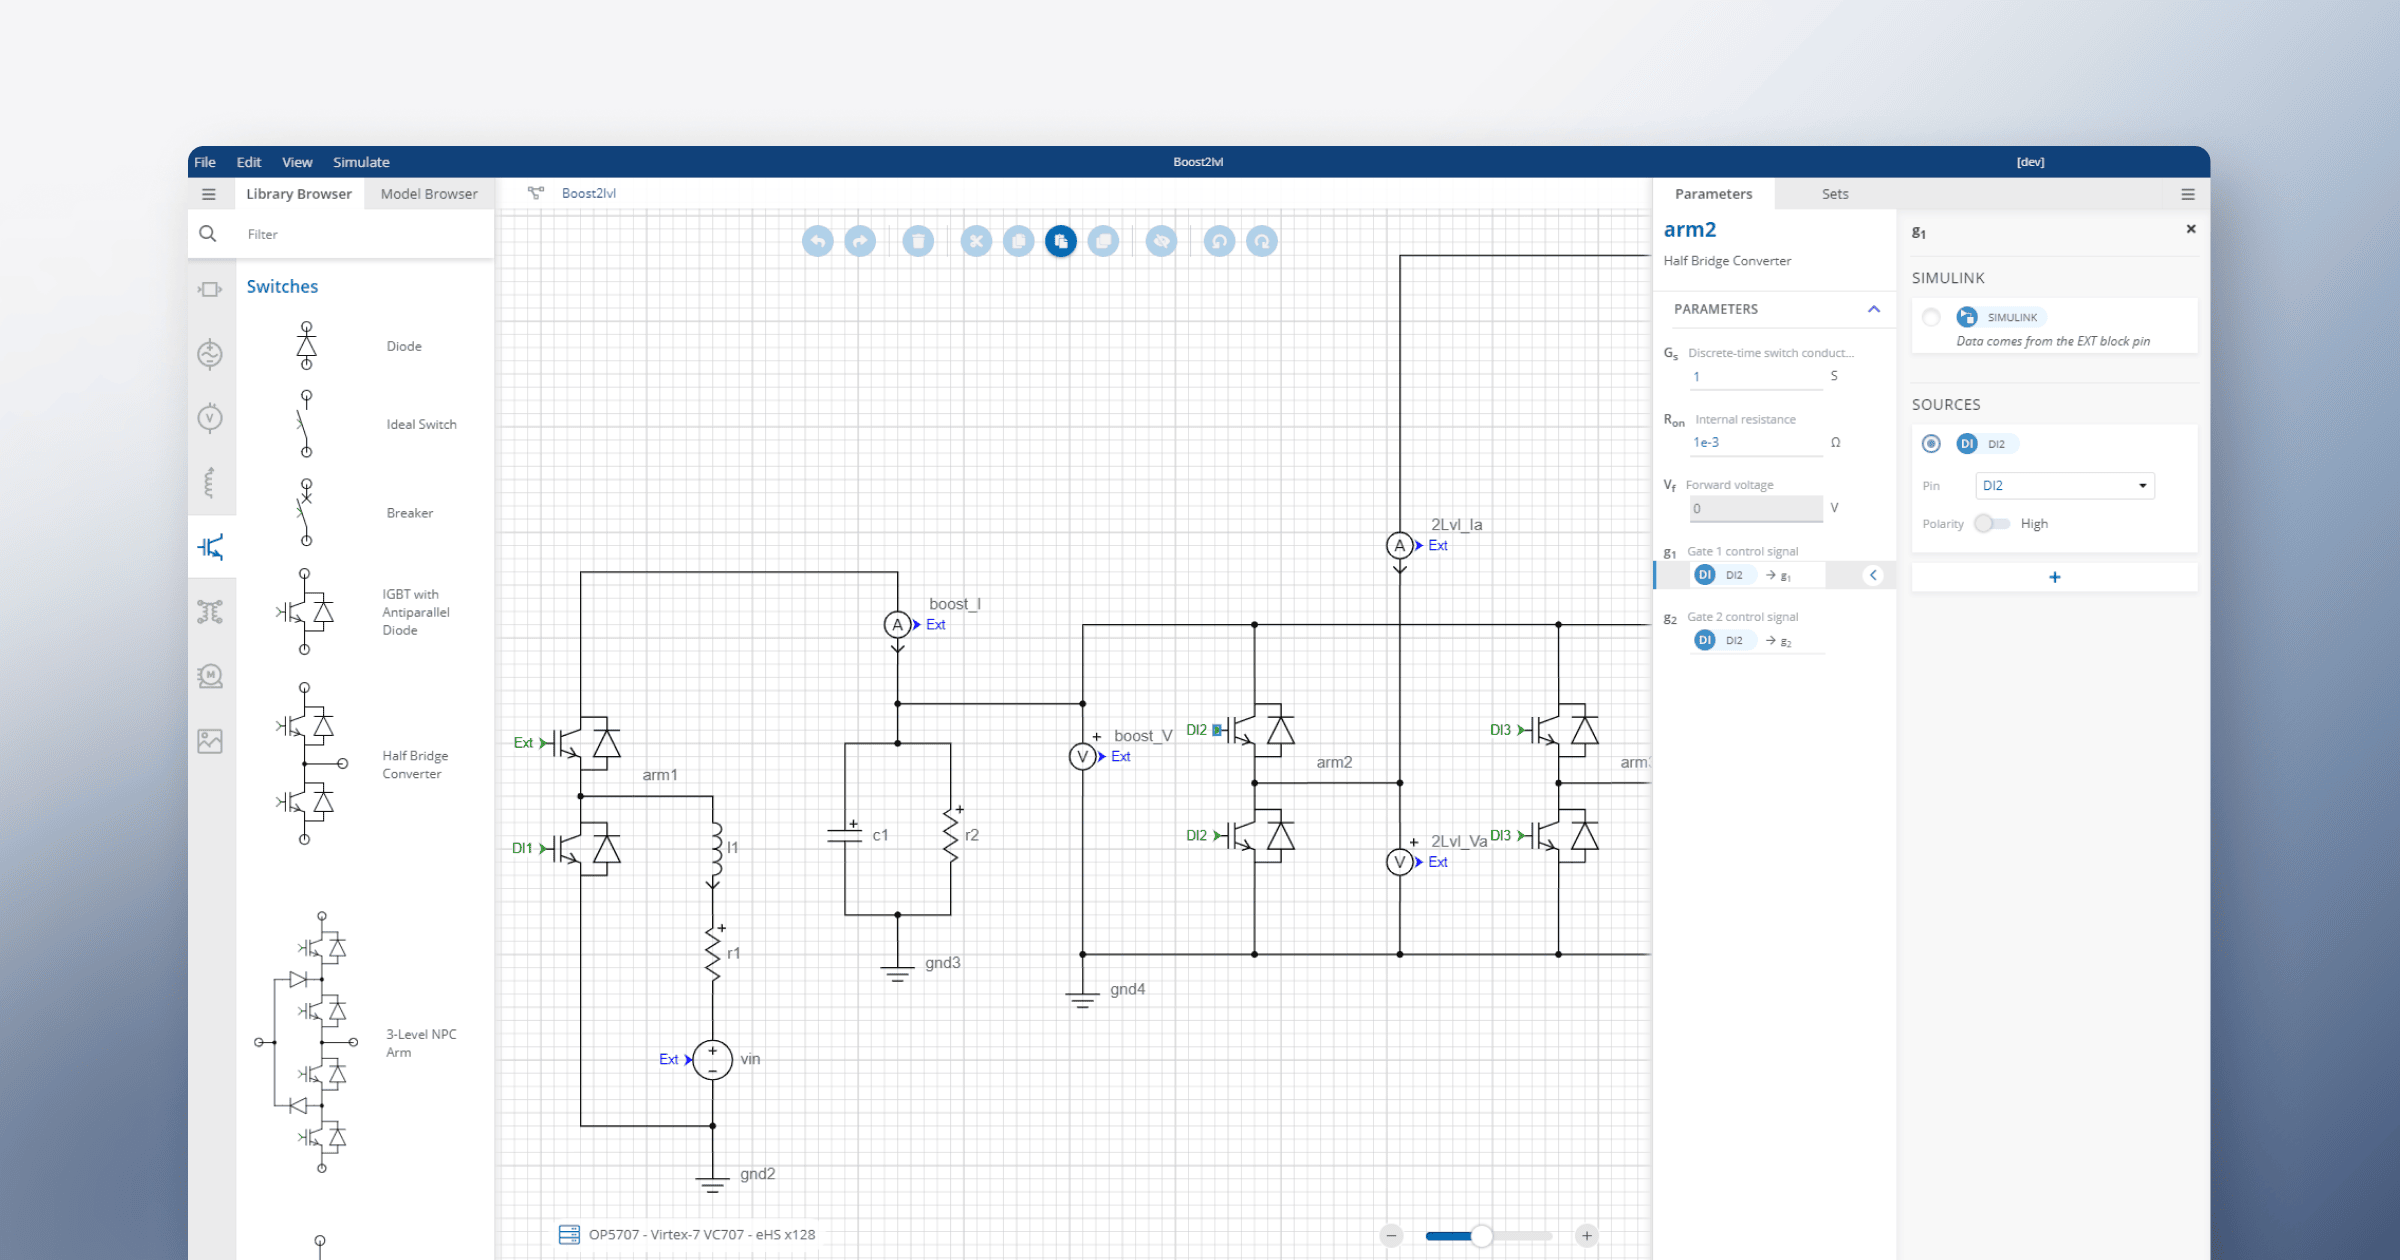
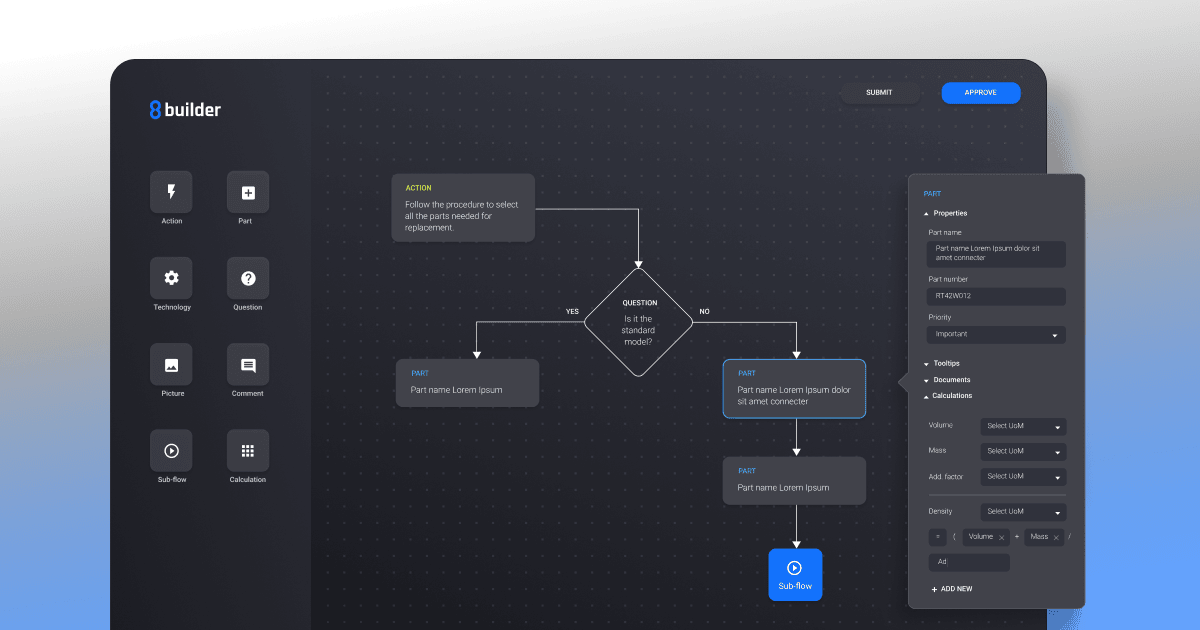
Designing a process flow requires very specialized engineering experience, but since not everyone working for a processing company is a process engineer, they should have a customized yet simple-to-read interface that displays the information they need to know in order to accomplish the tasks. The interactive palette with custom objects is the feature that enriches the diagram drafting platform we developed for the customer.
GoJS can keep your operations clear and organized
For example, production managers' work – be it procurement, facility management, safety and health regulations, etc. – will be much easier if they can get a dashboard that displays components that need to be purchased or will soon need replacement due to expiring warranty or abnormalities registered by sensors. Here, the visual libraries, such as GoJS come with help. The library enables simple drag&drop functionality that enables quick and easy operating on nodes, as well as positioning components at any place on the canvas. Instead of working with multiple drawings, applications, and plugins, our client uses a single platform that integrates into one interface their supplier libraries, equipment monitoring, and a financial system to help manage their budget. Not only can financial managers extract reports easily, but process designers will also know whether they're staying within budget limits as they add and modify elements of the drawing.
Faster and mistake-proof P&ID design process
Customized process design platforms can make the job easier, more reliable, and streamlined for engineers.
With a custom symbol library accessible to all stakeholders of the process plant, the P&ID elements stay consistent and updated across different projects and subunits of the company. One of the most valuable application features, for increased readability and efficiency of design, is being able to add custom nodes and links and nesting complex subsystems within a wider context. You can benefit from various functionalities that GoJS visual library enables you to use. A whole process loop can be displayed as a simple element in the process overview, and the internal details can be expanded into a separate drawing with one click. Selected parts of any P&ID can be hidden or shown as needed.
A custom-built solution that we developed with a client from the oil & gas industry, also integrates best design practices and safety rules to validate the P&ID in real-time, as it is being developed by the engineer. The design tool highlights the parts that need to be remade and display HAZOP warnings with safety recommendations.
And lastly, the platform enables real-time collaboration and P&ID (Piping and Instrumentation Diagram) review process to assure that no mistake or opportunity for improvement goes unnoticed by the engineering team. While working with IoT sensors connected to the system, the user can gather and observe the actual condition of the whole set-up. The visual representation enables ad hoc reactions and delivering the most suitable solutions to the occurring issues.
Live process flow simulation
For a client in the oil & gas industry, we developed an application that simulates events in the processing system, based on the Process Flow Diagram. The SCADA diagram below is a simple simulation of the flow along the pipes.

This simulation can reflect the exact changes that occur in the process flow when a selected part of the P&ID is manipulated. Depending on the user's needs, various alerts can be set up to notify of possible threats as certain elements are modified.
Using a diagram editor with a simulation feature creates a digital twin of the processing facility, which allows people involved in its operations to explore different scenarios, such as modernization plans or H&S (Health and Safety) scenarios.
While preparing and conducting simulations in P&ID, there are plenty of modern technical approaches merging visualization and engineering. JS visual libraries, such as GoJS, can be helpful as they work well for creating interactive diagrams used in simulations. In simple words, GoJS can be beneficial for simulations as it allows for reusable templates. The user benefits from previously created templates to superimpose data on them and observe changes in the simulation model. The GoJS makes the diagrams acting like a state machine that records, saves, and recreates the required state for further analysis. From the visual point of view, the GoJS enables choosing various data representations for one data model to change templating data. With virtualization functionality, the user can process bog data sets or map grid infrastructures.
Read more on how we created live simulation features for a client in the gas & oil sector.
P and ID diagram software moves your engineering forward
P&IDs are as old as the process industry. While the rules and guidelines of the domain have been more or less consistent over the past decades, the digital transformation has revolutionized the way engineering is done, and switching to a custom-built P&ID (Piping and Instrumentation Diagram) platform can make a significant difference by boosting productivity, reducing the number of applications used and lowering the risk of costly and dangerous mistakes.
Creating custom P&ID (Piping and Instrumentation Diagram) software with a dedicated development team can give you more than just a diagram design tool. You can build one platform for all your design, management, and security needs, with real-time monitoring and design simulation of the processing facility.
P&IDs are no longer just technical drawings and the digital solutions built to create and manage them reflect that.
- What is a P and ID diagram used for?
P&IDs are typically created by engineers who design manufacturing processes for physical plants. A P and ID diagram maps the functional relationship between mechanical equipment, piping or connection lines, control devices and instrumentation. It helps you see how all the equipment works together across plant and industrial processes, so you can spot risks early and make informed engineering decisions. P&IDs also support safety analysis by showing the placement of safety valves, relief systems and other critical protections. They make it easier to locate equipment for maintenance and guide troubleshooting throughout the system.
- What do ID symbols on a P&ID mean?
ID symbols represent visual markers used to describe instruments, valves, pumps, tanks, electrical connections and other system equipment components. They help you understand what each element is and how it fits into the system control scheme. While industry standards exist, many companies use their own symbol sets, so meanings may vary between organizations. Which is why every P&ID drawing includes a legend that explains the symbol specification.
- What can a P and ID drawing show?
A P& ID drawing maps how the entire system behaves. It can present sampling lines, flush lines, heat exchangers, storage tanks and other components, but also the logic behind them – such as control loops, interlocks and shutdown schemes safety. This combination of equipment and operational rules shows how the process runs from start to finish. P&IDs are foundational to the maintenance and modification of the process that they graphically represent.
- How is a P&ID different from a piping layout or schematic?
A P&ID focuses on the functional relationship between system equipment components, instruments and control logic. It shows how the system works, how each control device interacts and where safety or shutdown points belong. A piping layout or schematic shows the physical sequence and routing of pipes, fittings and connections.
In short, a P and ID explains system behavior, while a layout shows where components sit in space. When created digitally, both diagrams become easier to update, share and align with real-world changes – without redrawing entire projects from scratch.
- Why are digital P and ID diagrams better than traditional paper technical drawings?
Digital P and ID diagrams let you update projects in real time, apply changes without redrawing entire systems and keep every modification consistent by following templates. Multiple teams – from electricians to process engineers – can collaborate on the same diagram simultaneously, track revisions and maintain a single source of truth. This makes digital diagrams far more efficient, accurate and scalable than paper-based documentation.
- What industries rely most on P&ID diagrams?
P and ID diagrams are essential across industries that run complex plant processes or industrial processes. They are widely used in oil and gas, chemical production, energy generation, water and wastewater treatment, food processing and pharmaceuticals. Any operation that depends on precise control, safety and continuous monitoring relies on these diagrams to keep systems stable and compliant.
UX and Product Designer blending artistic vision with technical expertise and a research-driven mindset. Łukasz designs inclusive, accessible digital products where aesthetics meet functionality. He is passionate about cognitive psychology and how accessibility shapes user experience. In his work, he combines empathy, behavioral analysis, and attention to detail to create interfaces that support diverse user needs.

Find how we can help you enhance your software and win more deals
Contact us to discuss your project. After you submit the form, we’ll get in touch with you within 48 hours to arrange a call.